Shady Train - Calculating the Shady Side of every German High Speed Passenger Train
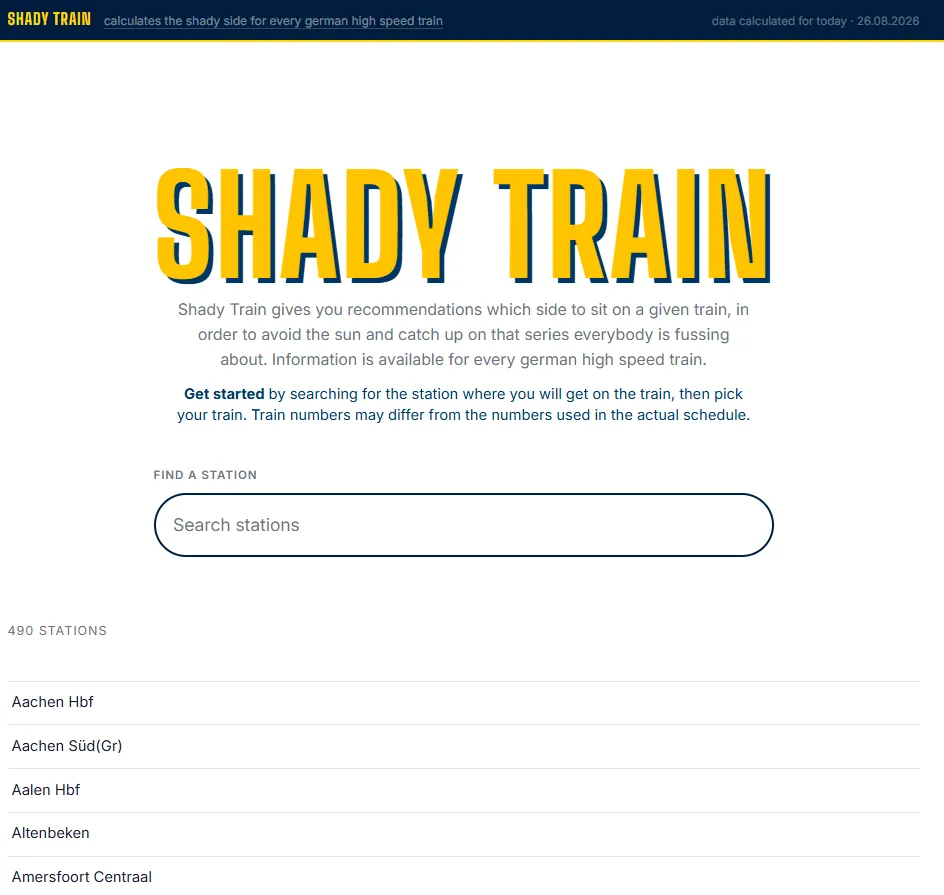
A few days ago I released Shady Train, a page that tells you which side to pick on a given train to sit in the shade. In this post I want to discuss how I build Shady Train.

Why?
I build Shady Train for myself. The train is my main mode of transportation when it comes to travelling to other cities in Germany. In the last month I often felt slightly inconvenienced when I sat on the sunny side of the train and couldn't read a book or watch a movie because the sun was shining directly on my face or my e-reader.
Throughout a journey, the train changes its heading and the sun its position, so it isn't possible to tell which side will be shadier when getting on the train. Thus, I envisioned a technical solution that would help me pick the shadier side of the train for a given journey.
How?
The system in itself is pretty simple. It's a moderately sized Python application that does the following things:
Calculate all train trips for the day
Using the dataset, which I will discuss later, the Python application calculates all train trips for the given day. The application generates a list of trips with names (such as ICE 42) and for every trip a list of stations the train calls at, with arrival time, departure time and geographic coordinates. I used the gtfs_kit Python package to work with the train schedule data. More on GTFS and the dataset later.
Calculate Shade Situation
For every pair of stations in every trip the application can now calculate the shade situation. To do so, it takes the departure time at the first station and the arrival time at the second station and calculates a bunch of intermediate points on a straight line between these stations. For each point it also calculates the time the train will pass through this point if it were travelling at a constant speed. The application also calculates the heading of the train.
The application is now able to calculate the position of the sun relative to every point at the time the train passes trough that point. I used the python astral package to get these calculations. The package calculates both the azimuth and the elevation of the sun as angles for a given point at a given time.
With the heading of the train and the azimuth and elevation of the sun, the tool has all the data it needs to calculate in which way the sun hits the train at the given point. I used some vector math, where I defined the head of a passenger as a point at the origin of a coordinate system. I also defined the two windows of the train to the left and right of the passenger as two planes orthogonal to the x-axis of my coordinate system. I defined the sun passenger relationship as a ray with its origin at the origin of the coordinate system and going in the direction of the sun (via the two angles azimuth and elevation). I then checked if and where the ray hits my left or right window plane and thus determined if the sun was able to reach the passenger and, if so, through which window. I recorded the result as simple left hit / right hit / no hit and did the calculation for every point between my two stations.
Afterwards, I did some simple statistics and checked if the majority of points got hit on the left or on the right or nowhere. Based on that statistic, I generated a recommendation for this section of the trip and saved it to the dataset.
The whole shade calculation also has an early exit condition. If for a given station pair, the first station is left after dusk or the second station is reached before dawn, then it is certain that no sun will shine during the whole trip section and there is no need to do the computationally more expensive per-point calculation.
As a side note: the assumption that the tracks between two stations can be approximated by a straight line is debatable. There are, of course, bends in almost all tracks between two stations, but I believe they are mostly negligible. Of course I would have loved to use the real tracks and not an approximation. Check the section "Data Source" of this article to find out why I didn't.
Outputting the data
After the shade situation is calculated for every trip, the data can be outputted for the user. I use the jinja package to render all the data to HTML pages for easy consumption as a website.
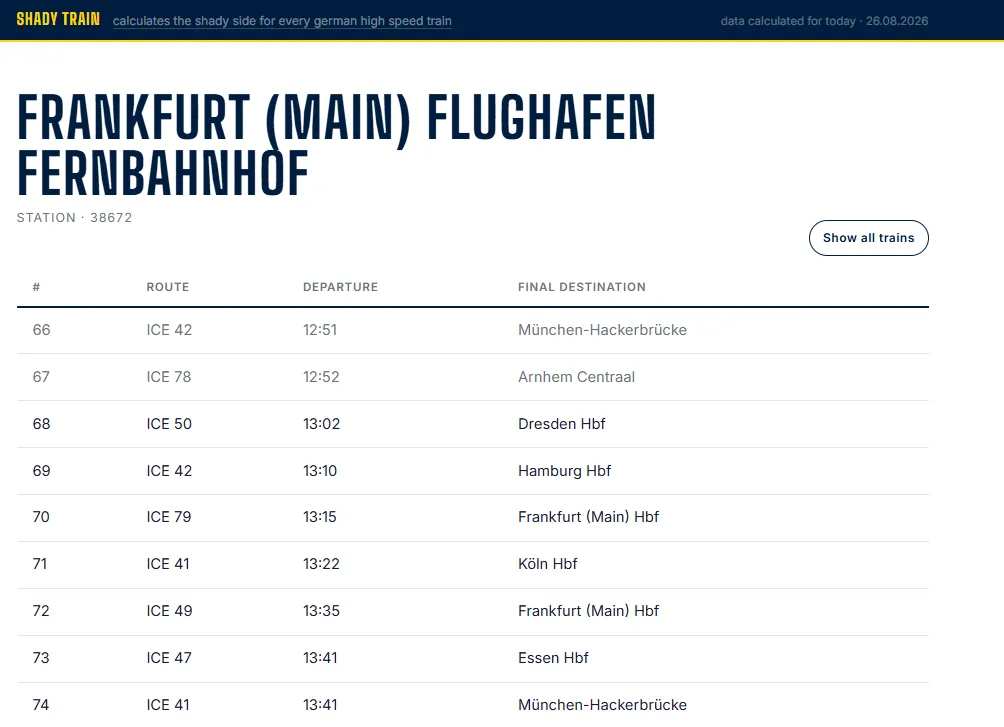
The render script generates one page for every trip with all the stations and shade recommendations listed. The render script also generates a page for every station that is part of at least one trip. Every train that calls at that station is added to a list for the station page. Lastly, the render script generates an index of all stations; that is also the landing page for the whole offering.
The templates and the CSS are kept extremely simple. I wanted something that loads fast and doesn't need to render a bunch of stuff via some bloated PWA approach. I think I succeeded with that. The pages use a minimal amount of plain JavaScript. There is one script for searching/filtering the station list and one script for hiding all trains who already departed at a station.
Hosting the page
Because the pages are plain HTML, they are pretty simple to host. I use Cloudflare's free offering because I was already familiar with it, and I can just point it to my GitHub repo, and it builds the pages for me. There is even a hook to trigger a rebuild, which I automatically call every day at 2 AM, to recalculate the page for the day.
Data Source
The data source is, of course, the foundation that this whole thing rides on. I used the "Schienefernverkehr Deutschland" feed (long-distance rail transport Germany) from gtfs.de.
GTFS (General Transit Feed Specification) is a data format for sharing public transportation schedules. It was developed originally by Google and is now the de facto standard for sharing schedules. The data provided by gtfs.de contains the schedules for all German high-speed passenger trains (IC/ICE) and was good enough to build Shady Train. However, I would have liked more and better data to build a better version of Shady Train.
GTFS is oftentimes also called GTFS Static as opposed to the newer standard GTFS Realtime, which offers real-time information. The data being static leads to two quality of life problems in my application.
First of all, as anyone who ever traveled by train in Germany can tell you, delayed trains are a common occurrence. The more a train is delayed, the more off are the shade calculations. At this point I didn't want real-time data access to incorporate delays into my prediction, because that would break my beautiful simple build system.
But if I ever wanted to expand the application with real-time data, there currently is no possibility to do so. There are paid APIs by Deutsche Bahn, but no free offerings. I dove into the API rabbit hole by trying to find out where Marudor, developer of popular Bahn Experte, gets his real-time data from, and I came to the conclusion that initially he used a custom scraper but some years ago got hired by Deutsche Bahn and now probably gets special API access for his page, not available to non-paying third-party developers. (gtfs.de offers a real-time stream as a beta offering, but it doesn't seem to include Deutsche Bahn High Speed Trains.)
Second of all, the train numbers seldomly correspond with the real train numbers used by Deutsche Bahn on a given day. Thus, the user has to identify their train by selecting the station they depart from and then looking for the train that departs exactly at the same time as their booked train and has the same final destination but probably has a different name or no name at all. I don't understand why the dataset differs from reality here, because the Deutsche Bahn booking tools are also able to tell me the right train number weeks in advance, so I get the feeling that this is an intentional offering of worse data.
Besides this, the dataset also didn't include trains by Flix Train, which is one of the largest competitors of Deutsche Bahn in Germany. I don't know if this is due to Flix Train not sharing the data or gtfs.de not including it, but it would have been nice to have the data included.
Lastly, the dataset didn't include the shapes of the tracks. The GTFS format can store this information, but it is not mandatory. It would have been useful for better shade calculation. gtfs.de offers this data in a paid version, and I could have also guessed the tracks by getting a static map of all tracks and simply calculating the shortest route via train tracks between every station pair.
Closing thoughts
I am pretty happy with the final result. It works, and while it has some limitations, mainly due to data quality, it is still completely usable.
I am also happy with the architecture, especially that the whole thing is at its core a complicated static site builder, with a static output. Not a conundrum of web services with a thousand moving parts.
I was also delighted that I could utilize some vector math to check if a passenger gets hit by the sun and through which window. Felt really engineering.
Most importantly, I am happy that I not only started a project but also finished it.
Pictures